Tuesday, November 13, 2018

Lines and slopes and intercepts, oh MY!


Howdy, related to my posts about using Excel in Calculus, I have this project that I use on lines and slopes and intercepts.  Again, it is a gentle introduction to programming cells in Excel.  In this one, I have students vary each of the three parameters individually and examine what effect the changes have on the values of the slope and the intercepts. 

Again, the point of these is to start having students learn to use a spreadsheet, and to also examine the idea of playing with parameters. 
Again, DM me on twitter or elsewhere if you want the files.
 *** Instructions start here ***
  All of the lines we look at in this project will be of the form Ax + By = C 

1.       Replace the fake ID number with your own Blinn ID number.  (Purple boxes)
2.       In the yellow background boxes, we will keep B and C the same, and change the value of A.  Notice that the template will automatically give you the different values of A.  You will need to program Excel to compute the slope and the coordinates of the two intercepts.
a.       As you increased the values of A, did the slope increase or decrease?  Explain why this would have to be so.
b.       Which coordinates changed, and in which direction?
c.       Which coordinates stayed the same?
d.       Describe visually what in effect we were doing with the line.  (so, spinning it about a specific point, sliding it up or down, both, neither, etc)
3.       In the green boxes, we will keep A and C the same, and change B.  ** Same four questions

4.       In the blue boxes, we will keep A and B the same, and change C.   ** Same four questions

5.       So which change seems to have the biggest effect on the slope, and why does that work?


 The numbers from the first half.


The numbers from the other two sets of variations.


Thursday, November 1, 2018

Excel Projects in Calculus part 5

If you need background, see my first post:
First Excel in Calculus post.
** If you want the Word and Excel copies, @me (@robebymathdude) on Twitter **


The last of my Excel projects in Calculus posts.  I did five mainly because I also have the students do memos (see  ) and there are only so many weeks in the semester.  I made it a point when laying out the schedule to not have a memo or project due during an exam week, so that is one reason for having five.  The other is the grading load!

Anyway, in this project I wanted the students to explore Riemann Sums but in a way that involved more than just calculating the sums.  (If you didn’t know, sites like Wolframalpha will do a Riemann sum with ease.  See for example: Example Sum

I also wanted the students to try and go back to a function, so I had them do sums for 1/x, and then see that the basic log rules worked.  I had a few students who figured this out, but the majority just kinda shrugged on their answers.  I am going to have to think about how to get students to this point in a better / different way for next time.
Thanks for reading.


Wednesday, October 31, 2018

Excel projects in Calculus part 4

If you need background, see my first post:
First Excel in Calculus post.
** If you want the Word and Excel copies, @me (@robebymathdude) on Twitter **

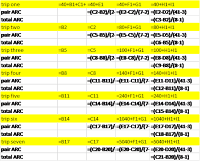
For this forth post, I wanted to focus on the sliding ladder problem that is almost always done when doing related rates.  I used their ID number to generate the length of the ladder and the sliding away from the wall speed.  The students then created several time values, starting from the ladder being vertical through to the near the end where the ladder is almost horizontal. 

The big questions / sticking points with the students on this one were where I asked (#11) for them to describe the pattern.  The fast – slow – fast pattern is pretty easy to see if you solve the problem in general as you get the solution below, and as you are near each extreme, you are dividing by close to zero.  It did lead to some good discussions, especially in class where I solved it in general and then we could talk about the function. 

The other one, that was kinda surprising to me, is #12.  I had expected them to mostly say “change in angle, as y/x is opposite over adjacent” and then we could talk about quotient rule and other things.  But we didn’t even get that far.  Best laid plans and all that……

BTW, contact me privately about the three related jokes in question 13 if you need help.  I just don’t want my students to stumble upon the answer too easily…


**** Instructions:
  1. Replace the fake ID number with your own Blinn ID number.  (Pinkish  boxes)
  2. Notice that this generates five different numbers for you, in cells B2 through B8.  You will use those numbers in answering the questions. 
  3. First, set up and solve the ladder sliding down the wall problem like we did in class, with the length and speed for your ladder the length and speed shown in cells B2 and B3 respectively.
  4. Notice that I have five boxes of numbers that are similar in set up.  The t-value or times for you should be thus:
    • The first two boxes (starting with cells B12 and B23) should be like mine, 0-1 and 1-2 in steps of 0.1.
    • The third box, (cell P1) the time should start with the “halfway time frame” computed in cell B6.
    • The forth box (cell P12) the time should start 1 second before the “end time frame” computed in cell B7.
    • The fifth box (cell P23) the time should start with the “end time frame” and go until the first time you get a negative value for “length of y”.
  5. Your “length of y” values should be computed from the t-value and the values in cells B2 and B3.
  6. Your “length of x” values should be computed from the relationship between x and y from the problem you solved in #3
  7. A.R.C. means Average Rate of Change, and notice in cell C17 this change is between t=0 and t=0.1.  Compute each of these based upon the numbers in the correct cells.
  8. The blueish-grey line in each box is the value of dx/dt computed from the relationship between x and y from the problem you solved in #3
  9. The Error in reddish background is the relative error between the “A.R.C. for x” and the computed “dx/dt from the equation on sheet.”
  10. “dy/dx numerically” is simply the ARC for y divided by the ARC for x.
  11. The “Error of two x rates” numbers seem to follow a general pattern.  Describe the pattern, and offer some explanations (so more than one) about why that pattern would be expected to be observed.
  12. Explain and show (so diagrams or equations or the like) what dy/dx represents in the context of this problem in terms of what you covered in precalculus. 
  13. The cell with a yellow background is 3 related jokes.  If you can clearly explain all three jokes, you will earn some bonus points.


Tuesday, October 30, 2018

Excel Project in Calculus part 3

If you need background, see my first post:
First Excel in Calculus post.
** If you want the Word and Excel copies, @me (@robebymathdude) on Twitter **


For this third Excel project, I wanted to stress to the students how much they assume continuity, and how big an impact that assumption plays in their expectations.  I got at this by having them conjecture about important places for the function, and then go back and revise those guesses depending upon some other work. 

This was in the section where we first encountered local extrema, and had spent a good bit of time with rates of change, so I wanted to expand on those ideas.

For the first set, I had displayed some (x,y) pairs, and then had the students guess where the local max occurred after first finding Average Rates of Change (ARC) between each pair of points.  Almost all said it had to be around x=3, and no one mentioned the assumption of continuity.  I then showed them the function with the vertical asymptote (1e below).  About half of the students when answering part (g) mentioned the assumption of continuity, but the other half did not.  
IDSUM is the sum of the digits in their ID number.  This gives related but different problems. 
1.       For the function F-1 (light orange background), we will do some data analysis.
a.       For each pair, find the Average Rate of Change (ARC) between the pair. (The first row is “x” and the bottom row is “y”)
b.       Where (between what x-values) does it appear the ARC becomes zero?  Why?
c.       Find the ARC for the entire data set.  Between what pair of x-values (if anywhere) does it appear the function has the same ARC as the ARC for the entire data set?  Why?
d.       Now find the sum of the digits in your Blinn ID, and call that IDSUM.
e.       Graph the function  


 Include the graph in your write up.  (Desmos, fooplot, or some other graphing device)
f.        Now compute   f(0), f(1), f(2), f(2.5), f(3.5), f(4), f(5), f(6)
g.       How does this change your answers to parts b and c of this question?  What were you assuming about the function F-1 when you answered parts b and c?

For the next parts, I had them repeat the ARC calculations, and then make some projections for future values.  They then compared their guesses with the actual function values.  For the first, the function was

But for the last pair, the function was not linear, but instead exponential:


I then asked the students how the estimates compared to the original estimates, and what assumptions they made. 


Excel Projects in Calculus part 2


This is the second of my posts on Excel projects in Calculus.  I had two main goals with this project.  First, I wanted to explore some limits and see some limitations of technology.  Then I wanted to help explore a type of word problem and drive home the idea of always checking the end points of the interval.  If you need background, see my first post:
First Excel in Calculus post.
** If you want the Word and Excel copies, @me (@robebymathdude) on Twitter **

For question 2, I had the students explore the two limits definitions of e (going to 0 and going to infinity)  You will notice I asked them to look at the formula and then match that formula to the correct limit. 
Then in parts b, d, and d I had them explore the other thing: in Excel there is an overflow error sometimes.  (This is inspired by a twitter conversation Chris Robbins @Grallator  and I had)  There was a good bit of confusion with the students over this, and I had to walk most of them through this to finally get the idea I was aiming at.  Which is fine, but a heads up if you do this in your classes.


The other part of this project was the standard something is out in the water, and we have to decide how far down the shore to run before swimming type of problem.  I used a lifeguard in this case.


I wanted the students to have to wrestle with the boundaries, so I did four different variations on the basic problem.  I first varied the running speed, then the swimming speed, then the total distance along the shore, then the total distance out.  I also arranged the step size for increasing the speeds to make sure we got to the boundary case in most instances.  I then programmed the Excel squares with conditional formatting to highlight red when that happened.  You can see some of that on my example sheet.
This proved interesting, as there were a couple of students who had no red cells.  (It was my fault, they happened to have zeros in just the right places!)  So they asked me, and I started by asking them to compare mine and theirs, and why might I use the color red.  It was generally a good discussion. 
The case where we changed the distance was more trouble for the students, as you ended up with almost a calculus of variations type of problem.  But given they are Calculus I students, most of them gave reasonable answers about what seemed to be happening.


Thursday, September 27, 2018

Excel Projects for Calculus - Part 1


Greetings, long time, no post!  Sorry about that, the legislature here in Texas really overhauled the way developmental mathematics (actually all forms) is done, and our department has been in a full scramble trying to navigate that.  (Maybe a few posts on that later, after I survive this semester)

** For the background, read the first post **
First Excel in Calculus post.
Anyway, for the upcoming AMATYC conference
https://amatyc.site-ym.com/page/2018ConfHome?
I will be presenting on Using Excel in Calculus.  (Friday from 3:10 – 4:00 if are you going) and while I have 50 minutes, I am doing five different Excel projects with my Calculus 1 students this semester, so I am blogging about the first few projects to make sure each project is discussed in some detail.

BACKGROUND:
To set the background, Blinn College is a 2 year College, and the Bryan – Villa Maria Campus is about 5 miles from Texas A&M.   Most of our students are trying to transfer to A&M, so we teach a large number of sections of Calculus (32 students each section).  Also, many of the introductory Engineering classes at Texas A&M use Excel, so I wanted to introduce the students to spreadsheets and also have them see their power.  We also have a campus agreement with Microsoft, so there is no problem with cost or access for students to Excel and Word, and I want them to show the formulas they program, so that is why we are using Excel instead of say Google sheets. 

One big thing I learned (this is semester 3 of doing these) is that most of the students had not used a spreadsheet before, and almost a third of them did not know you could program a spread sheet.  This is actually why this first project is so short, it allows the students to learn how to program a spreadsheet to calculate stuff they are already familiar with mathematically. 

On to the assignment:
When I assign this first project, I include three files in the submodule of our Learning Management System (LMS) the instructions (in Word format), the answers for my fake ID number (in PDF format), and an Excel template.  All three are posted below as images, but see the end if you want the original files for your own class.
The instructions have the students first put their own school ID number in the purple boxes, which causes all of the yellow and green cells to change value, as they are programmed off of the ID number.  This is so that each student has their own version, but I can still easily grade them.  The students then calculate some average rates of change with different descriptions of what the numbers are telling us.  (See the details in the instructions) 
When you read the instructions, you might have thought that there is more than one correct answer about the average rate of change for these questions.  Correct!  That is actually one reason I have the students define the function and provide units.  The students often are not consistent about what they program and what the write down.  This is part of the discussion we had in class about how average rate of change is more than speed, but it can apply to any function in all sorts of different contexts.

One thing about this: when I first assign the project, I open the template in class, and show the students how to program the cells.   Then, when I copy/paste, and the formulas compute the answer automatically, there is usually great excitement from the students.  Again, a good number were not aware of this ability in spreadsheets.  This is also a nice time to spend a few moments on the value of algebraic thinking.
Anyway, if you have comments, questions, etc., please let me know.  Thanks for reading.

** If you want the Word and Excel copies, @me (@robebymathdude) on Twitter **


Instructions:


Fake-Answers


With “fake” formulas


 Template***